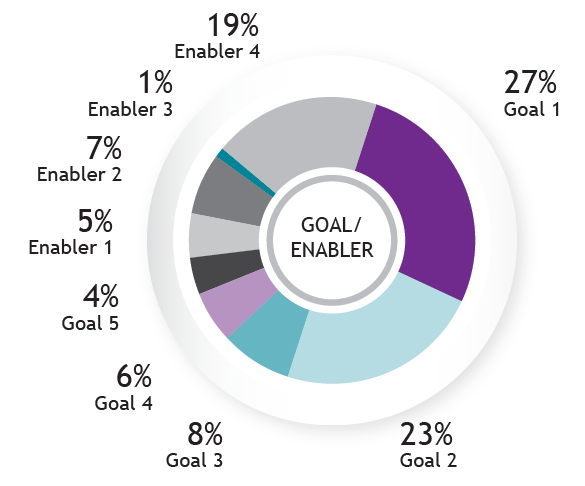
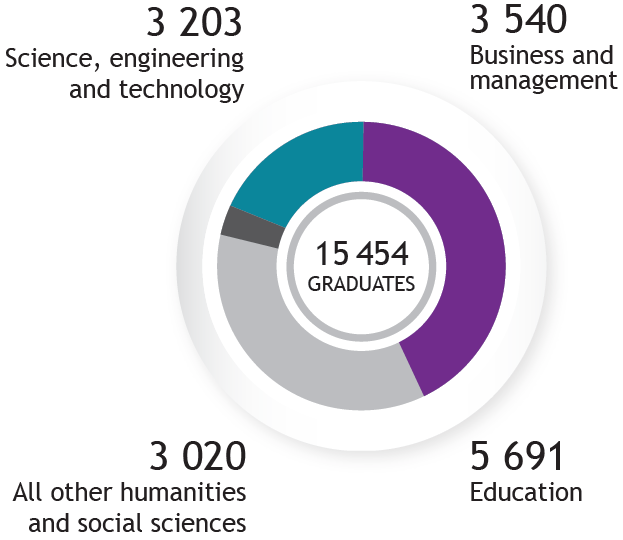
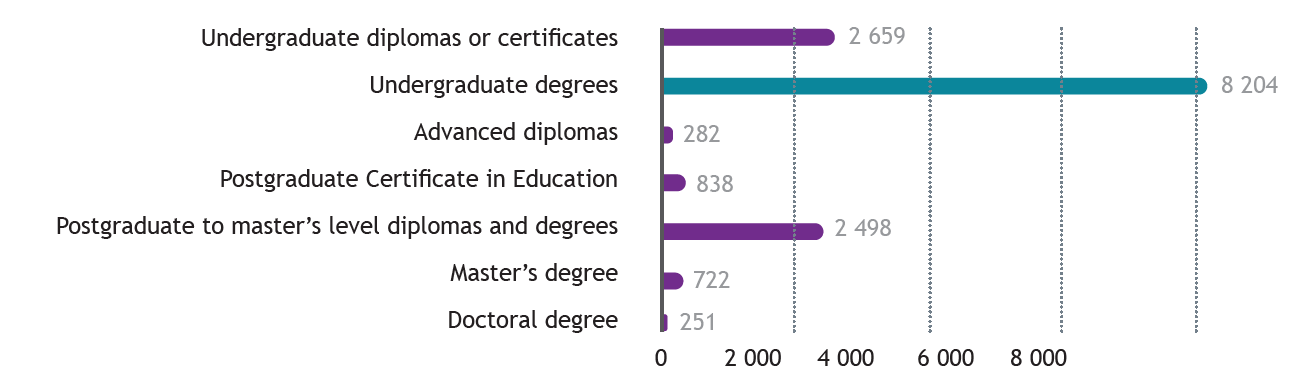
NWU Business model
- INPUT
- ACTIVITIES
- OUTPUT
- OUTCOME
INPUT
7 850 300
People reached through our online
student recruitment interventions
(social and relationship capital)
13 048
First-time entering undergraduate
students (human capital)
Number of students per qualification type (human capital)
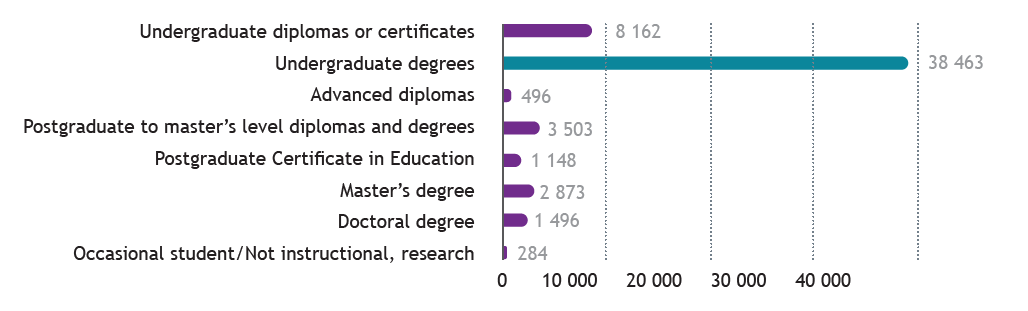
Budget (financial capital)
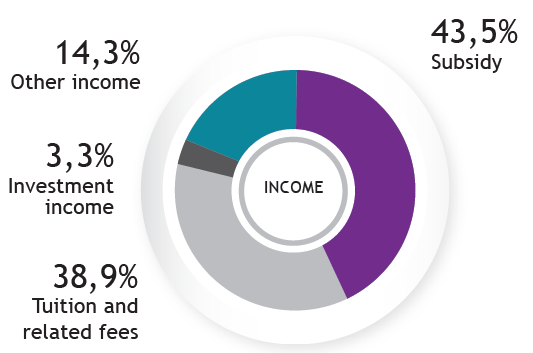
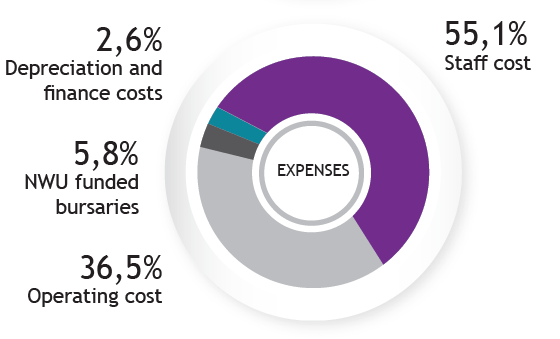
R 163
million
Spent on infrastructure
(Manufactured capital)
23,0%
increase in total assets
445 945
square metres
The total usable floor area of the NWU
1 110hectares
The total area occupied by the university’s campuses
(natural capital)
Academic and support staff (human capital)
| Personnel category | Permanent | Temporary | 2019 | 2020 |
| Crafts/trades |  |
23 | 26 | |
| 0 | 0 | |||
| Executive/ administration/ management professional |
|
90 | 82 | |
|
5 | 3 | ||
| Instructional/ Research professional |
|
1 575 | 1 612 | |
|
450 | 338 | ||
| Non-professional
administration |
|
1 289 | 1 294 | |
|
3 755 | 3 388 | ||
| Service | |
327 | 325 | |
|
40 | 59 | ||
| Specialised / support professional |
|
522 | 503 | |
|
229 | 160 | ||
| Technical | |
251 | 243 | |
|
50 | 44 | ||
| Grand total | 8 606 | 8 077 |